

In SECTION A, we examined how Britain squandered its North Sea oil bonanza, whilst SECTION B reveals the devastating long-term consequences of that failure.
Today, Britain faces a dual crisis:
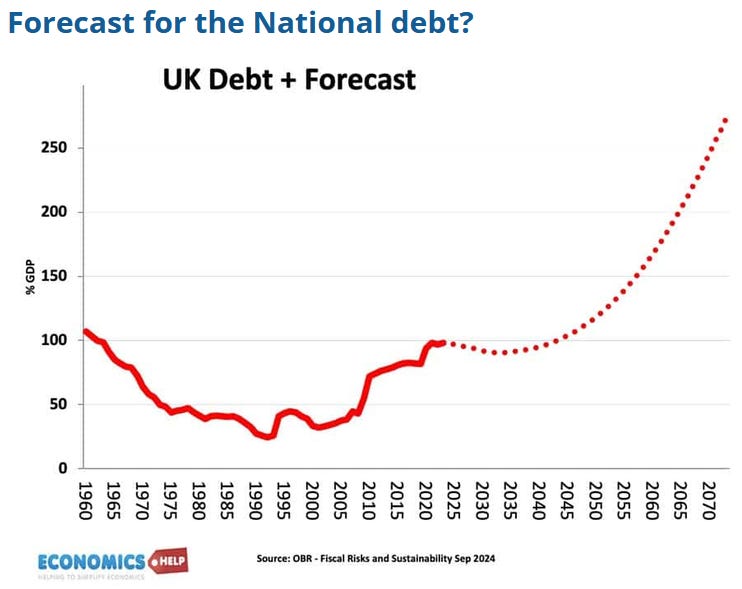
National debt of £2.8 Trillion ~ 94-95% of GDP.
Annual interest payments of £130 billion ~ up 54.4% year-on-year.
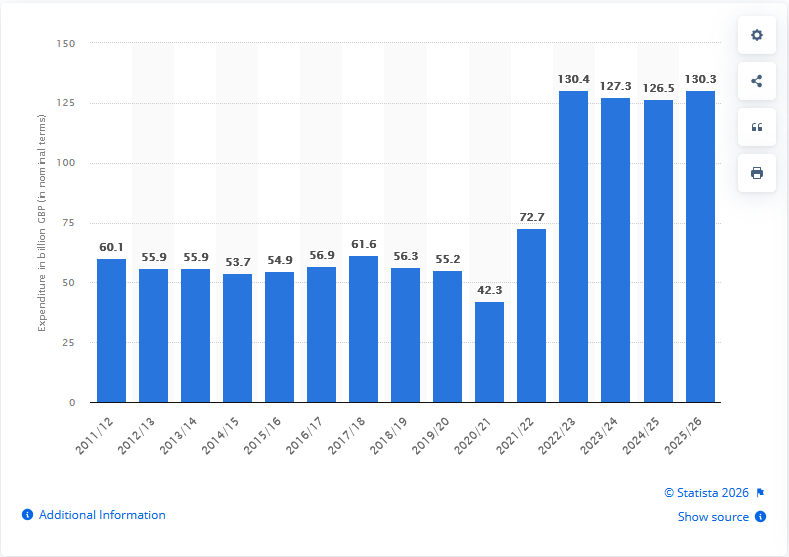
Source: statista ~ public sector expenditure on public sector debt interest
Meanwhile, Norway’s sovereign wealth fund generates investment returns that exceed Britain’s entire North Sea revenue collection.
This is not just history - it is Britain’s present reality, and Australia’s potential future.
The UK Debt Crisis ~ Current Reality
The Numbers Don’t Lie
As of 2026, the UK’s fiscal position has reached crisis levels:
Public Sector Net Debt:
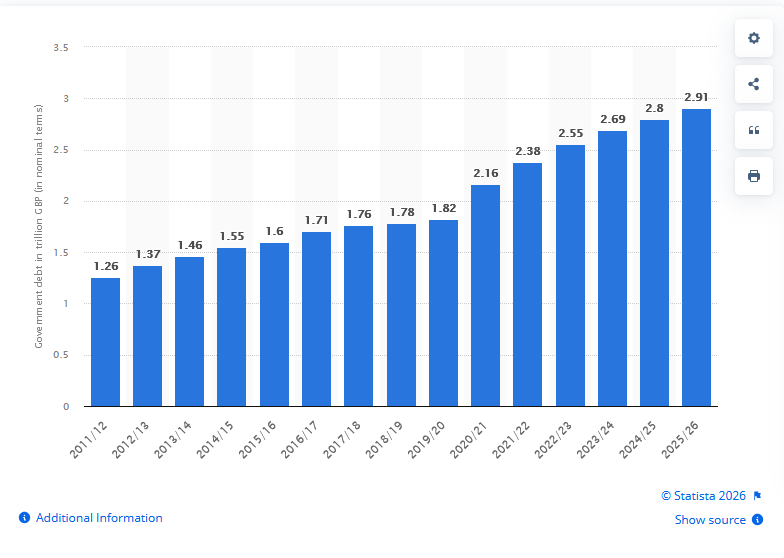
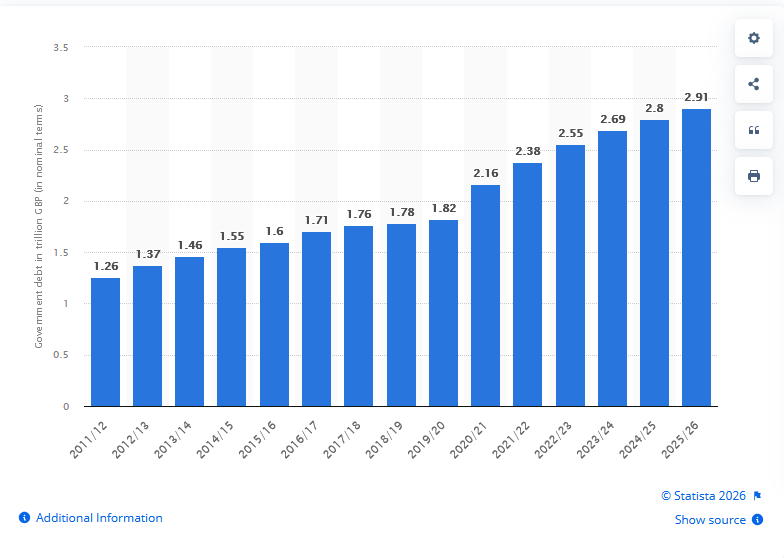
Source: statista ~ uk govt debt ~ 2012 - 2026
£42,000 debt per citizen ~ calculated from total debt ÷ 67 million population.
Interest Payment Burden:
The Trend is Alarming:
Monthly interest payments have surged dramatically:
April 2026: £10.3 billion ~ highest ever for April.
May 2026: £11.7 billion ~ 54.4% increase year-on-year.
June 2026: £11.8 billion ~ continuing the escalation trend.
Would the British Public be Happy about this possible trend?
What Does £130 Billion Mean?
To put this in perspective, the UK’s annual interest ~ that is, interest on the debt, created by not adopting the Norwegian Resource Sovereignty Blueprint ~ could fund:
The entire NHS England budget - £160 billion — almost in full
All UK schools funding - with money left over
Infrastructure investment - £130 billion could rebuild Britain’s crumbling infrastructure
Instead, this money flows to bondholders and creditors ~ generating zero productive value for British citizens.
The Counterfactual ~ What If Britain Had Followed Norway’s Model?
The Road Not Taken
Let’s examine the alternative timeline where Britain adopted Norway’s approach:
Scenario: UK Sovereign Wealth Fund (1975-2026)
If Britain had:
Created a state-owned oil company — such as Norway’s Equinor.
Maintained 50-67% state ownership of North Sea resources.
Established a sovereign wealth fund in 1990.
Saved oil revenues instead of using them for current spending deficits.
The Results Would Have Been:
Fund Value: £1.5-2.0 trillion - mirroring Norway’s Bonanza trajectory.
Per Citizen Wealth: £340,000-385,000 - just like Norwegians.
Annual Investment Returns: £60-100 billion - assuming 3-5% real returns.
Net Fiscal Position: Zero national debt - just as Norway has no sovereign debt.
The Stunning Reversal
Instead of:
Owing £2.8 trillion with £130 billion annual interest payments
Britain could have:
Owned £2 trillion in assets generating £80-100 billion annual returns
The swing is £210-230 billion per year ~ the difference between paying interest and earning returns.
The Intergenerational Theft
Who Pays? Who Benefits?
The privatization of North Sea oil represents one of the greatest intergenerational wealth transfers in modern history:
Generation 1970s-1980s ~~ Beneficiaries of Thatcherism:
Received tax cuts and increased public spending
Avoided painful fiscal adjustments
Watched private shareholders capture resource wealth
Generation 2020s-2060s ~~ Victims of Thatcherism:
Inherit a £2.8 trillion debt ~ that is trending higher.
Face £130 billion annual interest burden ~ which will only increase.
Receive no dividend from depleted resources ~ unless hydrocarbon exploration restarts.
Must pay higher taxes or accept reduced services ~ higher risk of social unease.
The Mathematics of Lost Opportunity
Total UK Oil Revenue ~ 1975-2025 = £400 billion
What Britain Actually Did:
Spent it all on current consumption & current account deficits.
Created zero lasting assets
Generated no intergenerational wealth
What Norway Did:
Collected £1.2 trillion ~ 3x more than UK despite similar resource levels.
Saved revenues and created a sovereign wealth fund.
Fund now worth $2 trillion and growing.
The £800 Billion Gap represents resources that flowed to private shareholders ~ and many foreign corporations, instead of British citizens.
Economic Consequences: The Compound Effect
Britain's failure to capture resource wealth has created a self-reinforcing debt spiral:
Specific Economic Impacts
1. Crowding Out Public Investment:
£130 billion in interest payments = cannot invest in infrastructure, education, or innovation.
Norway invests fund returns in public services without raising taxes.
2. Reduced Fiscal Flexibility:
UK must maintain high primary surpluses & tax increases, just to service the crippling debt.
Norway can run deficits during downturns, funded by its Sovereign Wealth Fund.
3. Vulnerability to Interest Rate Shocks:
UK interest payments surged 54.4% when rates rose.
Norway’s fund benefits from higher global interest rates ~ their Sovereign Wealth Fund Booms.
4. Intergenerational Inequity:
Young Britons inherit debt without assets
Young Norwegians inherit a sovereign wealth fund worth $385,000 per citizen ~ in 2026 statistics.
The Comparative Analysis: Visual Evidence
Key Financial Comparisons

The Stunning Reality:
Norway’s wealth fund = +$2T….. > UK’s total debt = -£2.8T ≈ $3.5T.
If UK had Norway’s fund, it would be debt-free with £500 billion surplus.
UK interest payments ~ £130B, exceed total oil revenue collected ~ £400B over 50 years!
Lessons for Resource-Rich Nations: Australian Warning
For Australians watching this analysis, the parallels are disturbingly clear:
Australia’s Current Position:
Major LNG and critical minerals exporter ~ but already being Plundered by foreign corporations.
Privatizing resources to multinational corporations MUST STOP!
Collecting minimal royalties and taxes ~ must be reviewed NOW!
No sovereign wealth fund for non-renewable resources ~ MUST be FIXED!
Rising public debt ~ must be addressed!
The Pattern Repeats:
Discover valuable resources ~~ gas, lithium, rare earths etc.
Grant extraction rights to foreign corporations at low royalties.
Capture minimal value for citizens.
Fail to save revenues for future generations.
Accumulate debt while resources deplete.
Leave future generations with nothing but environmental damage.
What Australia Must Do Now
Before It’s Too Late:
Establish Resource Sovereignty:
Create state-owned resource companies ~ as per Equinor in Norway.
Mandate minimum 50% state ownership of all major projects.
Renegotiate existing contracts where legally possible ~ or Declare Force Majeure ~ just as Qatar has because of the Middle East Conflict.
Build a Sovereign Wealth Fund:
Direct all non-renewable resource revenues to this fund.
Target: $1-2 trillion over next 30 years.
Invest globally for long-term returns.
Reform Taxation:
Implement resource rent taxes ~ like Norway’s 78% effective rate!
Eliminate subsidies to fossil fuel companies.
Capture fair value before resources deplete.
Intergenerational Equity:
Legislate that non-renewable resources belong to all generations.
Prohibit using resource revenues for current spending.
Create permanent endowment for future Australians.
Policy Recommendations: Britain’s Path Forward
Can Britain Still Fix This?
While Britain cannot recover lost oil revenues, it can conduct additional exploration for Oil & Gas within its North Sea Economic Zone.
~~ START TOMORROW!!
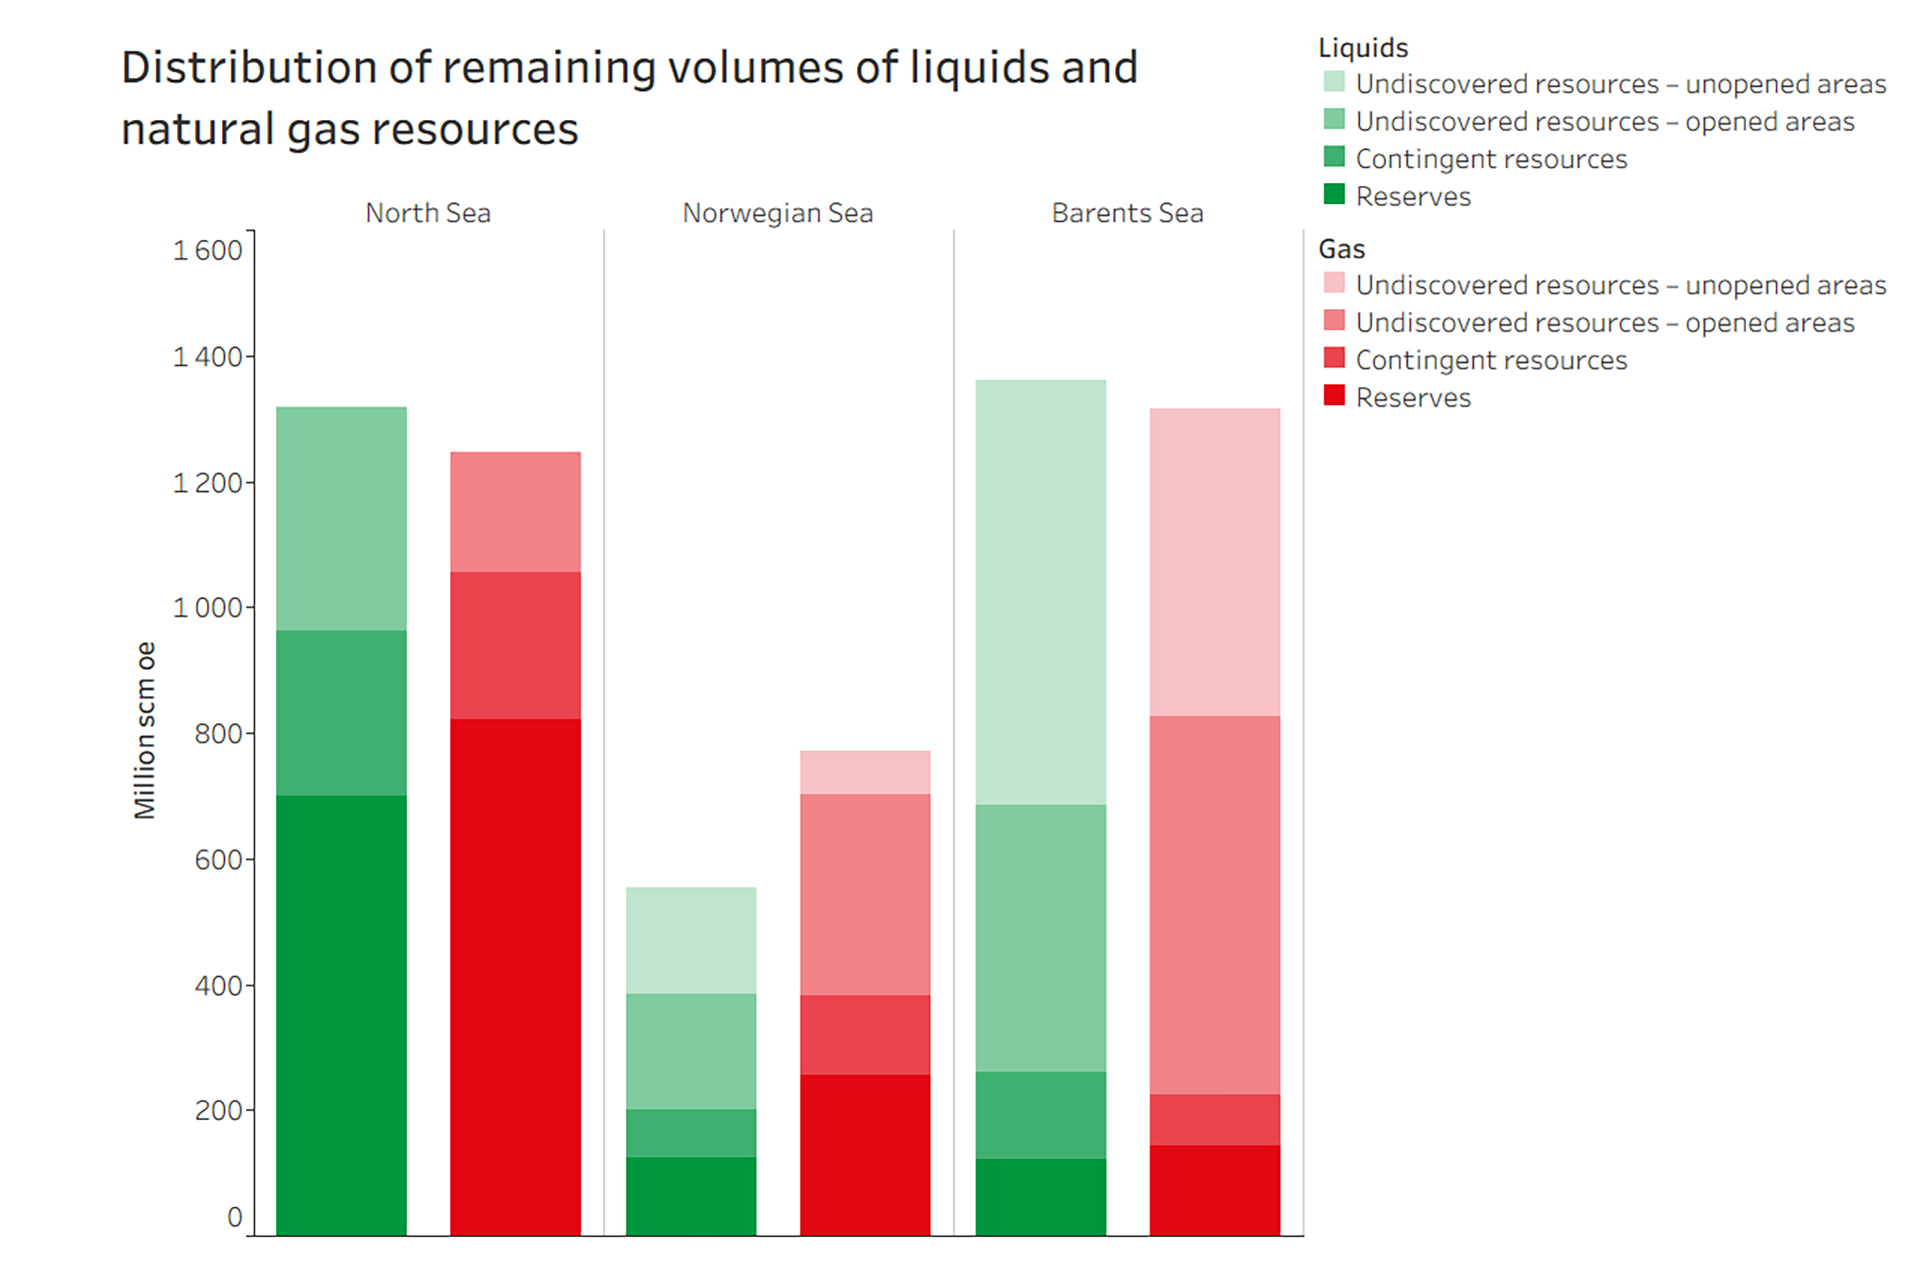
Norway has already done this ~ as you can see from this graph below, featuring undiscovered resources. Could the UK have similar results?
Short-Term ~ 1-5 years]:
Windfall Tax on Oil & Gas:
Increase Energy Profits Levy to 75% ~ matching Norway.
Apply retroactively to super-profits since 2022
Raise £50-100 billion for debt reduction
Create a UK Sovereign Wealth Fund:
Capitalize with windfall tax revenues.
Include all future North Sea revenues.
Add proceeds from carbon pricing.
National Infrastructure Bank:
Leverage sovereign fund for green infrastructure.
Generate employment and productivity gains.
The Bottom Line: Three Nations, Three Futures
Norway’s Future ~ 2026-2050:
Sovereign wealth fund grows to $3-4 trillion.
Citizens receive wealth dividend of $500,000+ per person.
Zero national debt, fiscal flexibility.
Resource wealth funds transition to post-oil economy.
Britain’s Future ~ If Status Quo Continues:
Debt remains at £2.5-3.0 trillion ~ potentially rising.
Interest payments consume £100-150 billion annually.
North Sea depleted with no replacement to generate wealth.
Intergenerational burden intensifies.
Britain’s Future ~ If Action Taken & Reforms Adopted:
Sovereign wealth fund reaches £500 billion-£1 trillion.
Debt reduced to sustainable levels.
New renewable energy sector captured for public benefit.
Partial recovery from a catastrophic historic mistake!
Australia’s Future ~ Choice Point:
Path A ~ Britain’s Failed Model ~ Resources privatized & plundered, debt accumulates, future generations lose their hopes, their homes & their future.
Path B ~ Norway Success Model ~ Resources captured for public, wealth fund built, future secured & next generation benefits.
The Uncomfortable Truth
Britain didn’t lose its North Sea oil due to bad luck, geological misfortune or a «Whoops-a-Daisy ~ where did all our sovereign resources go, moment?»
It was a policy choice.
Thatcher’s government chose privatization over public ownership!
Successive governments chose short-term spending over long-term savings!
Political elites chose corporate interests over citizen wealth!
Data Sources & Methodology
UK Debt & Interest Data
Office for National Statistics [ONS], Public Sector Finances (May–June 2026)
Public Sector Net Debt [PSND]: Approximately £2.98 trillion, representing around 95.1% of GDP
Debt Interest Payable: Central government debt interest payable was £11.8 billion in June 2026 alone.
Annualized debt servicing costs are currently running between £111–£114 billion, consuming roughly 8.3% of total government spending.
House of Commons Library, Government Debt and Debt Interest Briefing
In the 2024/25 fiscal year, the government’s net debt interest spending was £106 billion, equivalent to 3.6% of GDP or 8.2% of total government spending.
Borrowing costs remain elevated, with implied interest rates hovering around 4.9% for 10-year gilts and 5.5% for 30-year gilts in mid-2026
Source: commonslibrary.parliament.uk
Statista, UK Government Debt Interest Spending 2026
Total UK government debt surpassed £2.9 trillion in the 2025/26 period, continuing an upward trajectory from £2.8 trillion in the prior year.
Source: statista.com
Trading Economics, UK Government Debt Data
Confirms the macroeconomic trend: UK debt-to-GDP remains structurally high, with debt servicing costs heavily impacted by RPI-linked gilt payouts and sustained base rates.
Source: tradingeconomics.com
Norway Wealth Fund Data
Norges Bank Investment Management (NBIM), GPFG Reports
Norway’s Government Pension Fund Global [GPFG] reached a record valuation exceeding $2.2 trillion ~ approximately NOK 21.3 trillion ~ by the end of 2025 / early 2026/
Despite minor quarterly market fluctuations [e.g., a reported -1.9% dip in Q1 2026], the fund remains the largest sovereign wealth fund in the world, delivering strong long-term real returns.
Source: nbim.no
CNBC / Resource Governance Institute, UK vs Norway Oil Revenue Comparison
Norway’s Model: Channelled surplus North Sea oil and gas revenues directly into the GPFG, sterilizing the economy against «Dutch Disease» and building intergenerational wealth.
UK’s Model: Integrated North Sea oil revenues directly into general taxation and current public spending, leaving no equivalent sovereign wealth buffer or asset pool for the benefit of future generations.
Comparative Analysis
Economics Help, “Why Norway Became Rich From Oil But The UK Lost Out”
Norway’s population is only ~ 8% of the UK’s, yet its per capita wealth significantly surpasses the UK’s, driven entirely by the disciplined, long-term investment of its lucrative oil and gas industry.
The UK treated oil revenue as a windfall to offset budget deficits in the 1980s and beyond, rather than as a capital asset to be saved, invested and ready for future generations.
IMF, The Economics of Sovereign Wealth Funds
IMF analysis highlights that successful resource-rich nations use Sovereign Wealth Funds [SWFs] to smooth intergenerational wealth, manage commodity price volatility, and fund future pension liabilities ~ a structural advantage the UK deliberately bypassed to satiate foreign corporations.
Source: elibrary.imf.org
IFS Taxlab, UK Public Sector Net Debt Since 1700
Historical data from the Institute for Fiscal Studies shows that while UK debt has predictably spiked during major wars and crises [e.g., 2008 financial crisis, 2020s pandemic/energy shocks], the current ~ 95% of GDP trajectory is uniquely compounded by the structural absence of a resource-backed sovereign asset pool to offset liabilities.
Source: ifs.org.uk/taxlab